
Announcing Railshare1st
For commodity traders, institutional investors, economists and equity analysts:
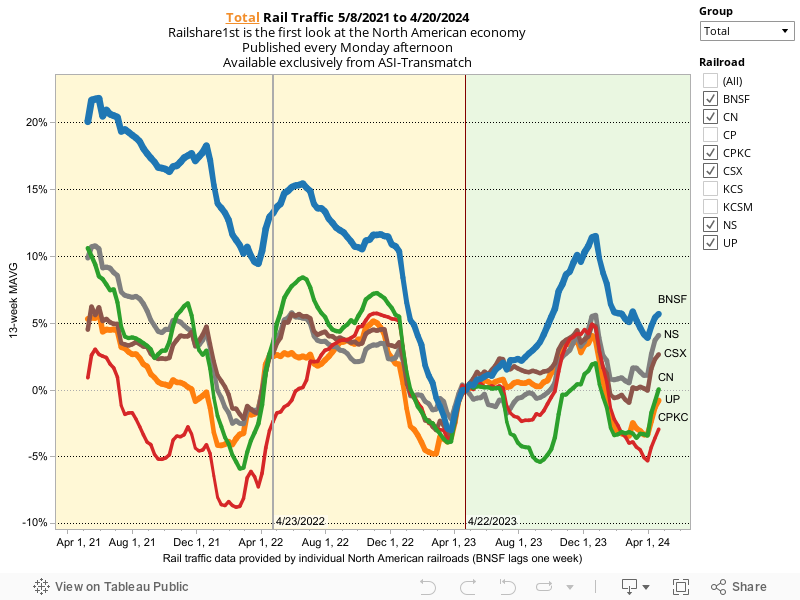
Every Monday afternoon we collect carloading data directly from the publicly-traded rail carriers.
We are now offering those data to professional investors who need the
fastest, most accurate measure of the health of the industrial economy and the railroads.
These data are 40 hours faster than the industry data published on Wednesdays.
If you would like to see a visualization of a summary of the RS1st data we publish on Monday,
please send us an email with your name and professional affiliation.
If you are a Railfax Subscriber and have a Userid and Password Click Here
to enter the full Railfax site.
Summary of North American Rail Freight Traffic
This chart summarizes rail traffic for all North American railroads by key commodity groups
Cyclical including economically-sensitive commodities such as steel and lumber
Baseline including commodities such as coal and grain which are less affected by the economy
Intermodal comprising primarily domestic and international movements of consumer goods by container
Railshare First subscribers get access to our Railfax report and our Railshare Highlights report. To view a sample report Click Here.
The annual subscription for the weekly Railshare data report and access to the Railfax carloading summary report is $125.
Click the Subscribe button to subscribe using PayPal or your Credit Card or call us with questions.
|
|
What is Railshare
Railshare is a comprehensive database of North American rail traffic. The data are reported by the individual railroads. Atlantic Systems Inc. processes this information and redistributes the data in an easy to use format. Each week's report covers the seven day period ending on Saturday. Rail traffic is disaggregated between carload (traffic moving in traditional freight cars such as box cars, tank cars and hoppers) and intermodal traffic (containers and piggyback service). Railshare provides commodity breakdowns for carload traffic; commodity detail for intermodal traffic is unavailable. The carrier totals shown in Railshare aggregate all traffic handled by individual carriers. Railshare graphs show four major breakdowns of rail traffic. Total traffic includes all carload and intermodal traffic; carload traffic is further divided between economically sensitive commodities (cyclical) and those that are less affected by the business cycle (baseline).